Seeking significance
Aren't we all?
As I head into the final month of my research leave, I've been working on a list called "math you need to keep." This is my attempt at boiling down the massive amount of new information I've put into my brain in this area into a handful of key points I hope to not just retain but absorb. To be honest, a lot has boiled off already...inevitably. But the first thing I decided had to go on this list was the concept of statistical significance. Okay, technically, that's not math, but it's more mathy than not, at least for me.
Before I studied statistics at all, I think I thought of statistical significance as something inherent to a specific result. Result, here, means the statistic you took based on your sample, often the mean or the difference between means of two samples. If the result was large enough in some way, it probably wouldn't be due to chance. This is a correct but superficial understanding, somewhat comparable to thinking that if a candidate for US president gets enough votes, they will win the election. Yes, sort of, but you won't really know until you put those votes into the context of what states they occurred in.
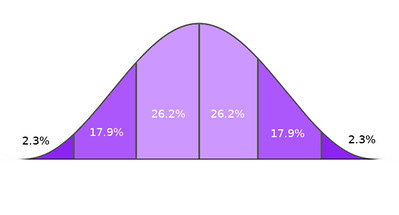
For statistical significance, as I have come to understand it, the context that you have to put the results in is not simply the sample that you have, or the two samples you might be comparing. The context you have to put your result into is the imagined world of all possible random samples that could be taken of a population. A population is that exhaustive collection of all the things you are trying to model--all the people, or all the books. Any given sample taken randomly from a population might either accurately reflect or totally distort the actual distribution of whatever you are trying to measure in the population, simply due to randomness. But, somehow kind of magically, if you take the mean of all these samples and then plot those, those means will be normally distributed, even if the population's distribution of that measurement is not. A normal distribution is more popularly known as the bell curve: the mean is the high point in the middle, and all other values occur with decreasing frequency as you go higher or lower than that.
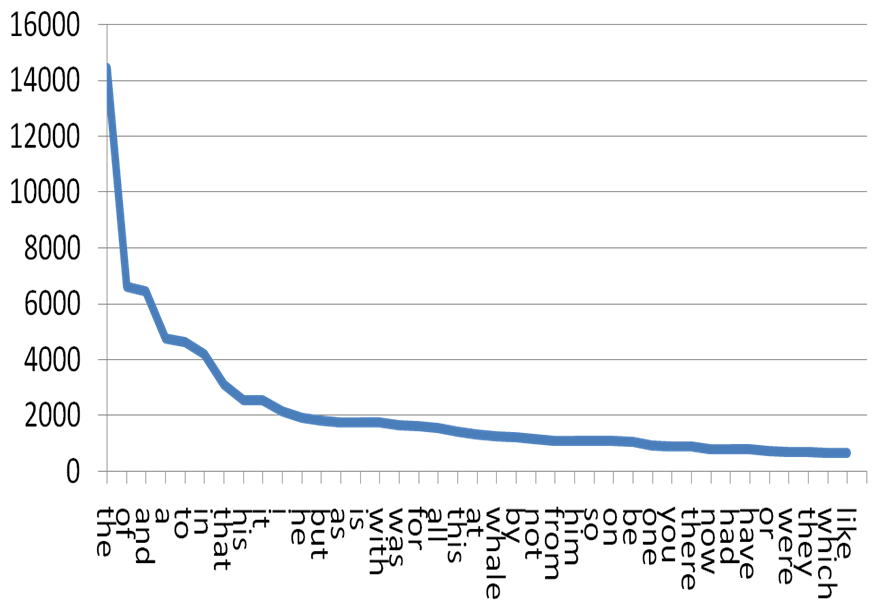
This idea that the means of samples are always normally distributed is called the central limit theorem, and without it, as far as I understand, we would not be able to talk about statistical significance. And we certainly wouldn't be able to talk about it for something as bizarre as language use. Many things in the natural world seem to occur in a roughly normal distribution, but language use is not one of them.
Because of the central limit theorem, we can contextualize our sample mean in this broader world of all possible samples. If all we have is the mean of one sample, we can use the fact of the CLT to determine what the standard deviation of these population means would be. The standard deviation of sample means--not the standard deviation of your particular sample-- is called the standard error of the estimate, but it works like a standard deviation: it is the size of one "click" away from the mean, and 99% of all possible values will occur within three clicks. The difference is, the standard error is imagining the total world of sample means, not describing the world of your specific sample.
When we know the standard error of the estimate, we can then create a confidence interval for the value of estimated means, which is a range of values below and above that single measurement that is some degree of likely to contain the true value for the population.
Statistical significance comes in when we have two measurements to compare. If we have the means of two different samples, we can use the CLT to quantify the likelihood that any difference between them is due to the chance of what got randomly sampled. If that likelihood is not very high, there is a stronger argument that there is something actually different about the populations that those two samples are drawn from.
Whether the two populations are, say, modernist and not modernist, or all just writers. We could do that, right?
As I grapple with how to compare corpora of modernist and not typically recognized as modernist writers of prose fiction based on the words they use, it occurs to me that some concept of statistical significance could come into play.
I've been trying to come up with a set of words to use as a "modernist vector": words that seem to be distinctive or distinctively used in the modernist corpus. I've thought of a few ways to do this:
Assembling a list of words based on modernist studies scholarship, for example, like Werner Sollors's contention that "car" (motor or street) marks a defining scene of modernism.
Assembling a list of words based on AntConc's built in distinctiveness measure.
Assembling a list of words used more frequently by modernists than they are buy non-modernists.
I've spent time this past week working on the third approach, and here is what I've tried:
Used AntConc to get the top 5000 words by raw frequency in the modernist and non-modernist corpora (I have sampled down the latter so they are roughly the same number of tokens, so raw frequency seems okay, at least for exploratory purposes.)
Used Python to generate a list of words unique to each corpus, and then skimmed those to remove character names.
Used Python to generate a list of words that are in both corpora but used with significantly different frequency ranks.
My first instinct way of doing this ways to find out what the average difference in frequency rank was between the two corpora, and then make two lists: one with words more highly ranked in the modernist corpus, and one with words more highly ranked in the non-modernist corpus.
And then I remembered that I could probably now do better than this first instinct way of defining higher than average and/or significantly different. And that's kind of where I'm at--trying to think through what this probably do better method would be.
One mental stumbling block here is thinking that I have to be able to do this in a way that accounts for every word on the list, all in one go. Maybe I can eventually, but maybe a better way to start ramping up my brain is to think how I would compare the frequencies of one word in both corpora.
And somehow, that switching the framework to one word has reminded me of a different method that I learned about in Anthony Kenny's Computation of Style, the best statistics for literature book I have yet found: it's called the chi square test, and it's a way of testing the significance of an observed difference between two categorical variables.
As an example, I did the highest ranked word on the more than averagely frequent words in the modernist corpus list: "living". For those of familiar both with US modernism and what is in the public domain and already transcribed, you will know that this means that Gertrude Stein is in your corpus. So, right away, I know I need to dig in more and see just how outsize of an effect Stein is having on these results, and perhaps adjust data preparation accordingly. Meanwhile, though, here's what happened when I did the chi square test:
Step 1: Get the raw counts and the total corpus token count for each corpus.
US Mods: 9772 uses in 6297974 tokens
US Not Mods Sample: 641 uses in 4656308 tokens
Step 2: Use these numbers to create a contingency table that compares the expected number of usages we would see if there was one constant rate of usage across the two corpora to the actually observed usages in each.
Step 3: Enter these numbers in a chi square test calculator, because knowing what math you need to do doesn’t mean you have to do it yourself.
Step 4: Significance, with above caveat re: Stein and needing to think more about whether to stem the words or otherwise account for her potentially large effect.
I still think there must be a way to calculate a confidence interval for a word's frequency to have a sense of how a different sample might have affected it, but I think if the chi square test fits and I know how to use it, this works.
My next step along these lines would be to either figure out how to wrap all of this into a Python script to calculate this for the entire wordlist...which would also require extracting a different dataset...or decide just how many of these would be reasonable to test to decide if a higher than average difference in usage ranking was a reasonable proxy for significant usage difference.
Whew, it feels like I got there eventually, but it also feels like it took me longer than it should have. I think this phenomenon is one reason why being a generalist is hard: the satisfaction of instantaneous, confident expertise is rare, no matter how much you learn. You don't get regular opportunities to apply specific concepts. I don't run tests or read studies every day that stretch my statistical significance comprehension muscles.
But I did a bit today, and that will be a little tiny bit I can draw on next time.


